BLOG POST
PostgreSQL at Scale: Lessons from a Trading Platform

We chose PostgreSQL over Oracle and MySQL back in 2015, and I'll be honest: it raised eyebrows. Today, barely anyone blinks. But getting here - scaling it to survive real production trading load - required going far deeper than the default postgresql.conf and praying. This is the full story. Everything we broke, everything we fixed, and everything I wish someone had written down before we learned it the expensive way.
Fair warning: this is long. Get a snack.
Why PostgreSQL? Why Not Oracle, Why Not Mongo, Why Not $WHATEVER
Let me get the obvious question out of the way first because I'm tired of answering it at conferences.
ACID compliance is not negotiable in financial systems. Every order insert, every fill update, every position adjustment must be transactionally consistent. PostgreSQL gives you true serializable snapshot isolation - the real thing, not the watered-down "eventual consistency" that MongoDB and Cassandra offer. When an order is partially filled and positions need updating atomically, eventual consistency means one inconsistent balance could cascade into actual financial loss. I've seen it happen at a previous shop. Once is enough.
PostgreSQL's NUMERIC type provides arbitrary-precision arithmetic without the floating-point rounding errors that will absolutely ruin your day in financial contexts. The difference between 6.0 * (3.0 / 10.0) returning 1.8 (NUMERIC) versus 1.7999999999999998 (FLOAT) is the difference between correct P&L and a reconciliation nightmare that eats your entire weekend. Every monetary amount in our system - prices, quantities, balances, fees - uses NUMERIC(18,8). Yes, there's a 3–5x performance penalty over hardware floating-point. I don't care. Correctness is not optional when real money is on the line.
Then there's the licensing math. Oracle Enterprise Edition runs approximately $47,500 per processor core before annual support fees. For our 12-core production servers, that's over $400,000 annually in licensing alone. PostgreSQL costs nothing. We redirect that budget toward better hardware, more engineering time, and a proper HA infrastructure. If your CTO is still paying Oracle licensing in 2017 for workloads PostgreSQL can handle, they're lighting money on fire.
Beyond the cost argument, PostgreSQL gave us capabilities no other open-source database matched in 2015–2016 when we were making the call: JSONB for flexible instrument metadata alongside strict relational schemas, partial indexes for querying only active orders (a massive win over full-table indexes - more on this later), BRIN indexes for time-series market data, window functions and CTEs for real-time P&L calculations, and LISTEN/NOTIFY for lightweight event propagation between services. The arrival of parallel query in 9.6 last year and logical replication plus declarative partitioning in the just-released version 10 have only widened this advantage.
A note on the Uber controversy: their widely discussed blog post from 2016 about migrating from PostgreSQL 9.2 to MySQL actually reinforced my confidence. Their complaints about write amplification from ctid-based indexing and WAL verbosity were legitimate for their specific workload - extremely update-heavy with many indexes on wide tables - but they were running a four-year-old version. PostgreSQL 9.6 and 10 have addressed many of those concerns, and the community's technical rebuttals demonstrated a healthy, responsive development culture. For our workload - high write throughput with carefully managed indexes - PostgreSQL performs exceptionally well. Sometimes you have to read past the headline.
The Architecture That Survived Peak Trading Hours
Our deployment has evolved considerably from the single-node setup we started with. Let me walk through what it looks like today because the architecture decisions are inseparable from the scaling lessons.
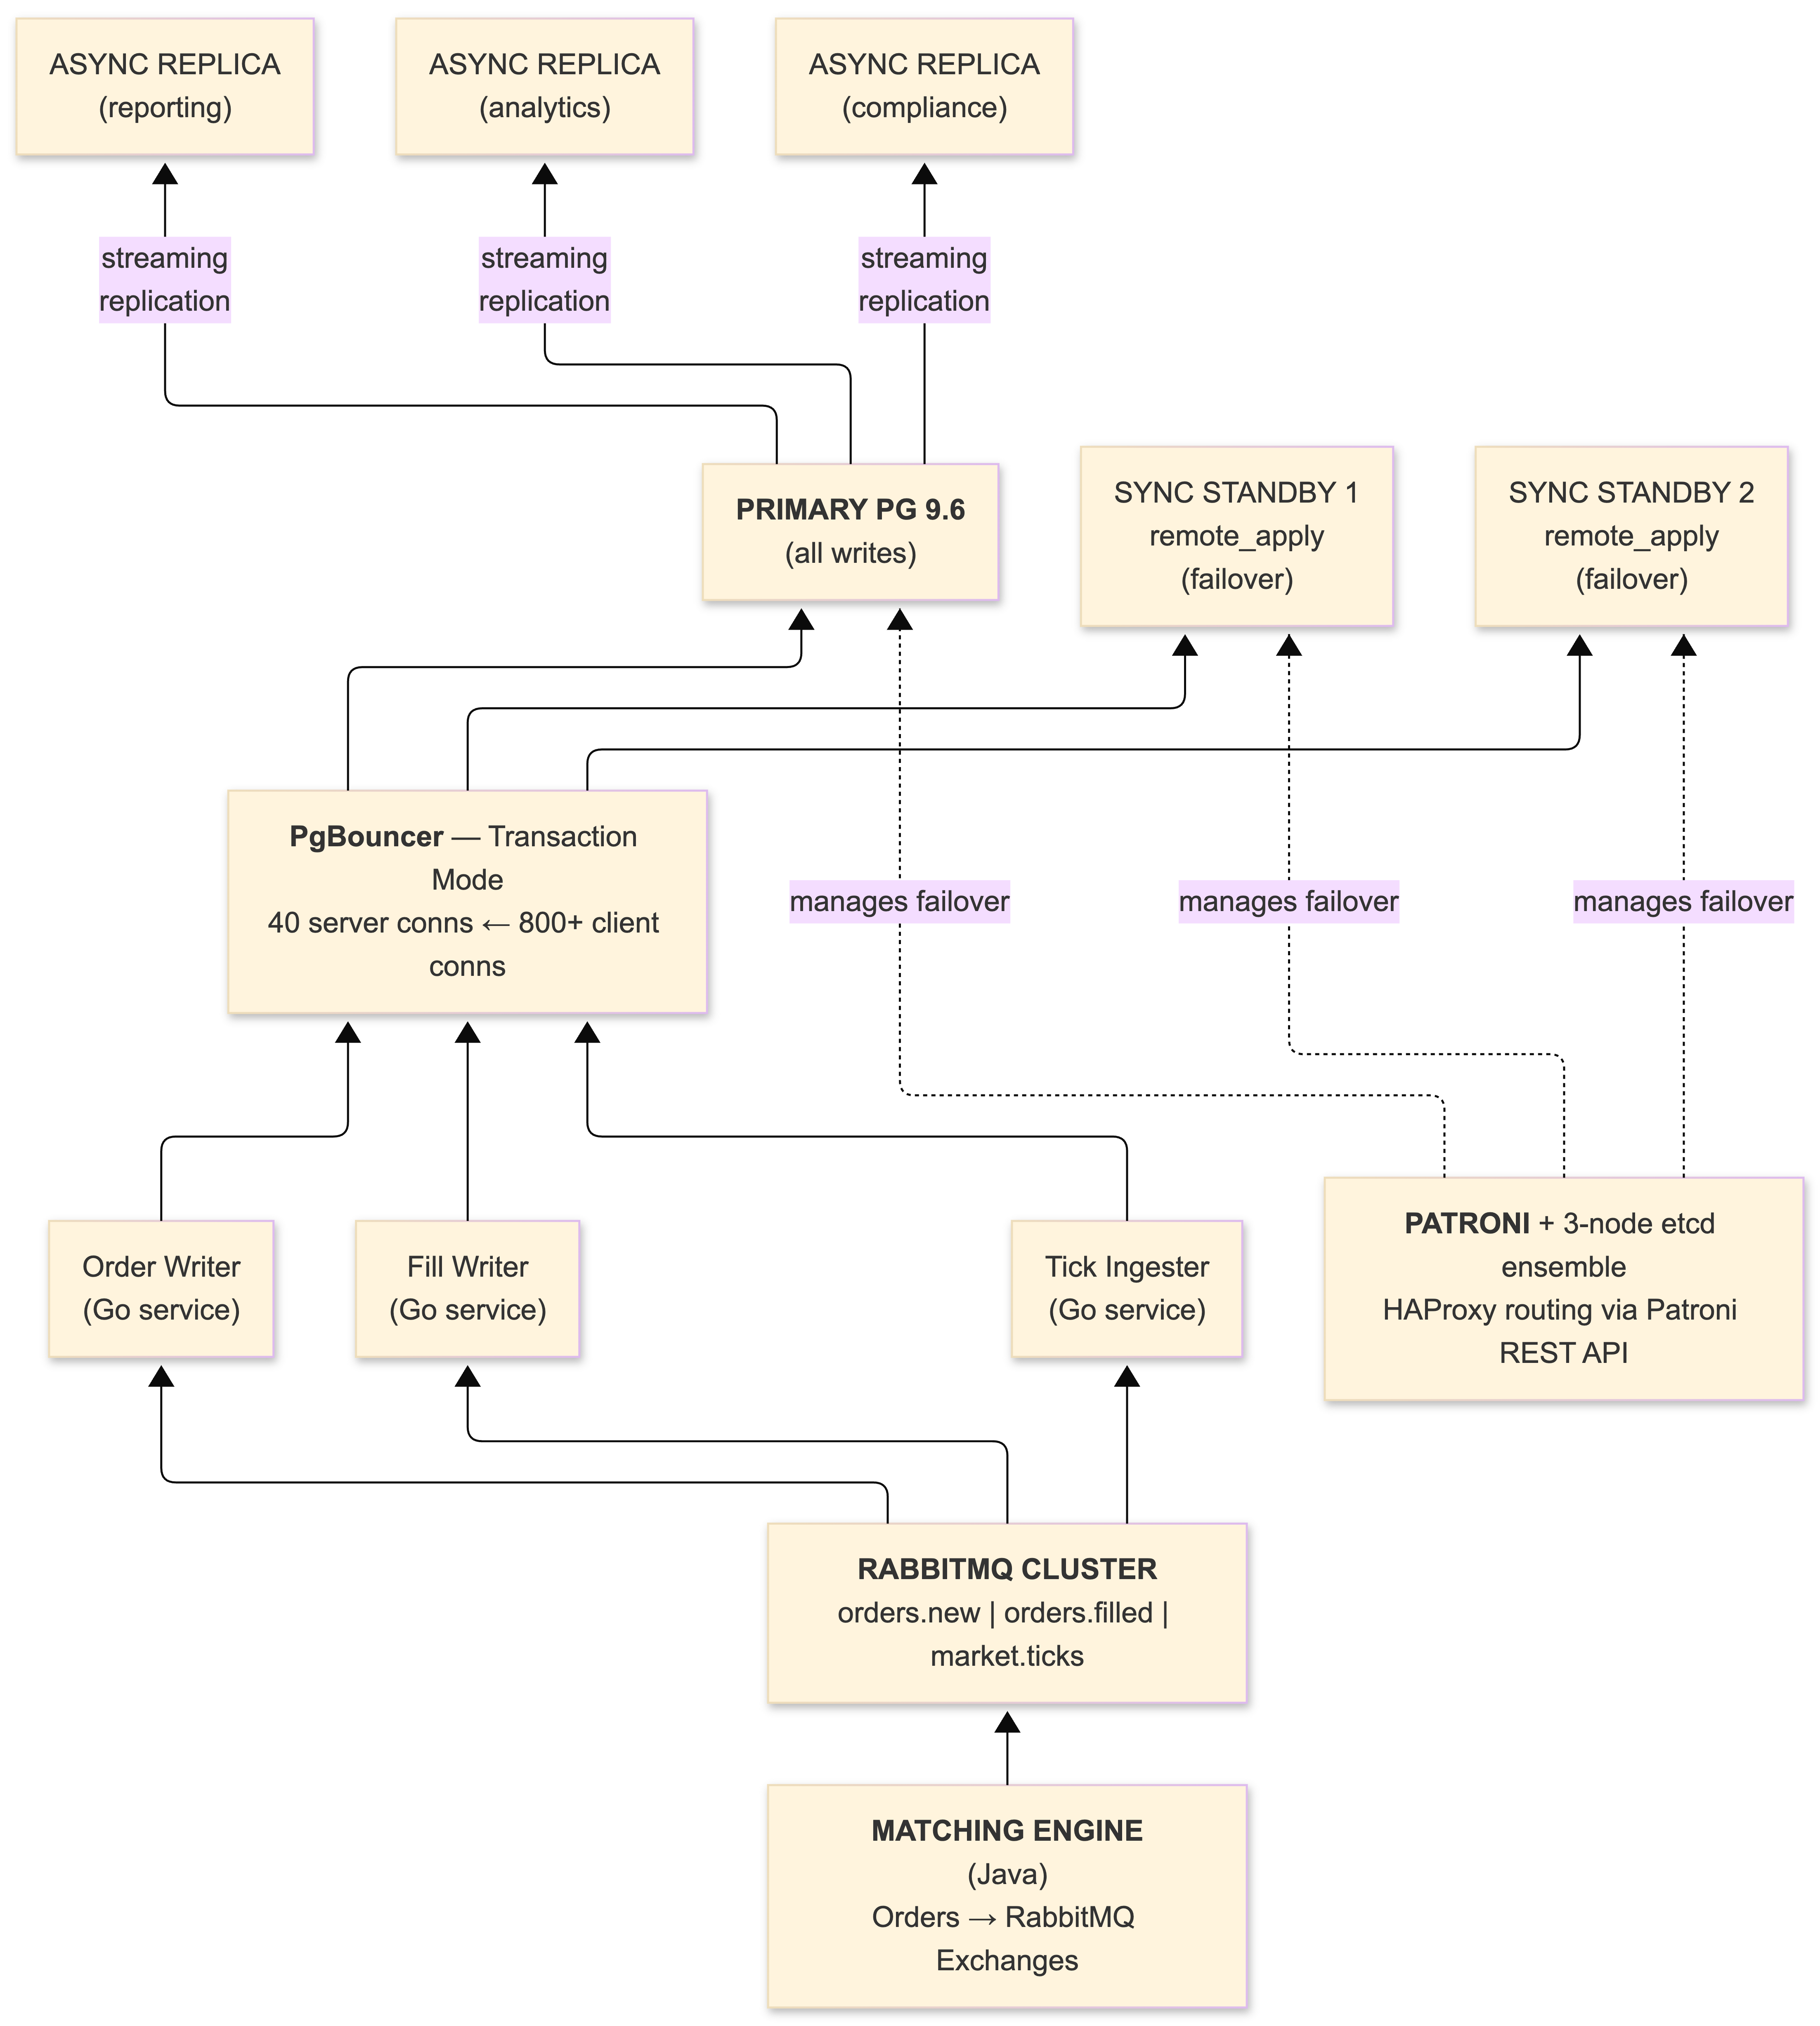
The PostgreSQL 9.6 primary handles all writes - order inserts, fill updates, position adjustments - fronted by PgBouncer in transaction pooling mode. Two synchronous standbys using remote_apply mode provide zero-data-loss guarantees and consistent read-after-write semantics. Three additional asynchronous read replicas handle reporting, analytics, and compliance queries. Market data ingestion runs against a separate PostgreSQL instance with aggressive BRIN indexing and inheritance-based partitioning by date.
Patroni manages the HA cluster, coordinating leader election through a three-node etcd ensemble. When we tested failover by killing the primary during simulated market hours, Patroni promoted a standby and updated our HAProxy routing within 12 seconds - well within our 30-second recovery time objective. The maximum_lag_on_failover parameter (set to 1MB in our Patroni config) prevents promotion of replicas that have fallen too far behind. That guardrail has prevented data divergence during network hiccups more than once.
RabbitMQ sits between our matching engine (Java, because the financial ecosystem still runs on the JVM whether we like it or not) and PostgreSQL. Orders flow from the trading engine into RabbitMQ exchanges, then our Go consumer services pull from queues, write to PostgreSQL, and update positions. This decoupling means the matching engine never blocks on database latency, and we get automatic retry semantics with dead-letter queues for transient database failures. Read-side services consume from RabbitMQ to maintain materialized views in the read replicas - a CQRS pattern that cleanly separates our write-optimized and read-optimized paths. The Go services are thin by design: consume from the queue, execute the SQL, ack the message. No business logic in the database layer. No business logic in the messaging layer. Clean boundaries.
PgBouncer: The Unsung Hero (Or: How We Stopped Burning RAM)
PgBouncer deserves its own section because deploying it was the single most impactful change we made to the entire architecture. Not a query optimization. Not an index. A connection pooler.
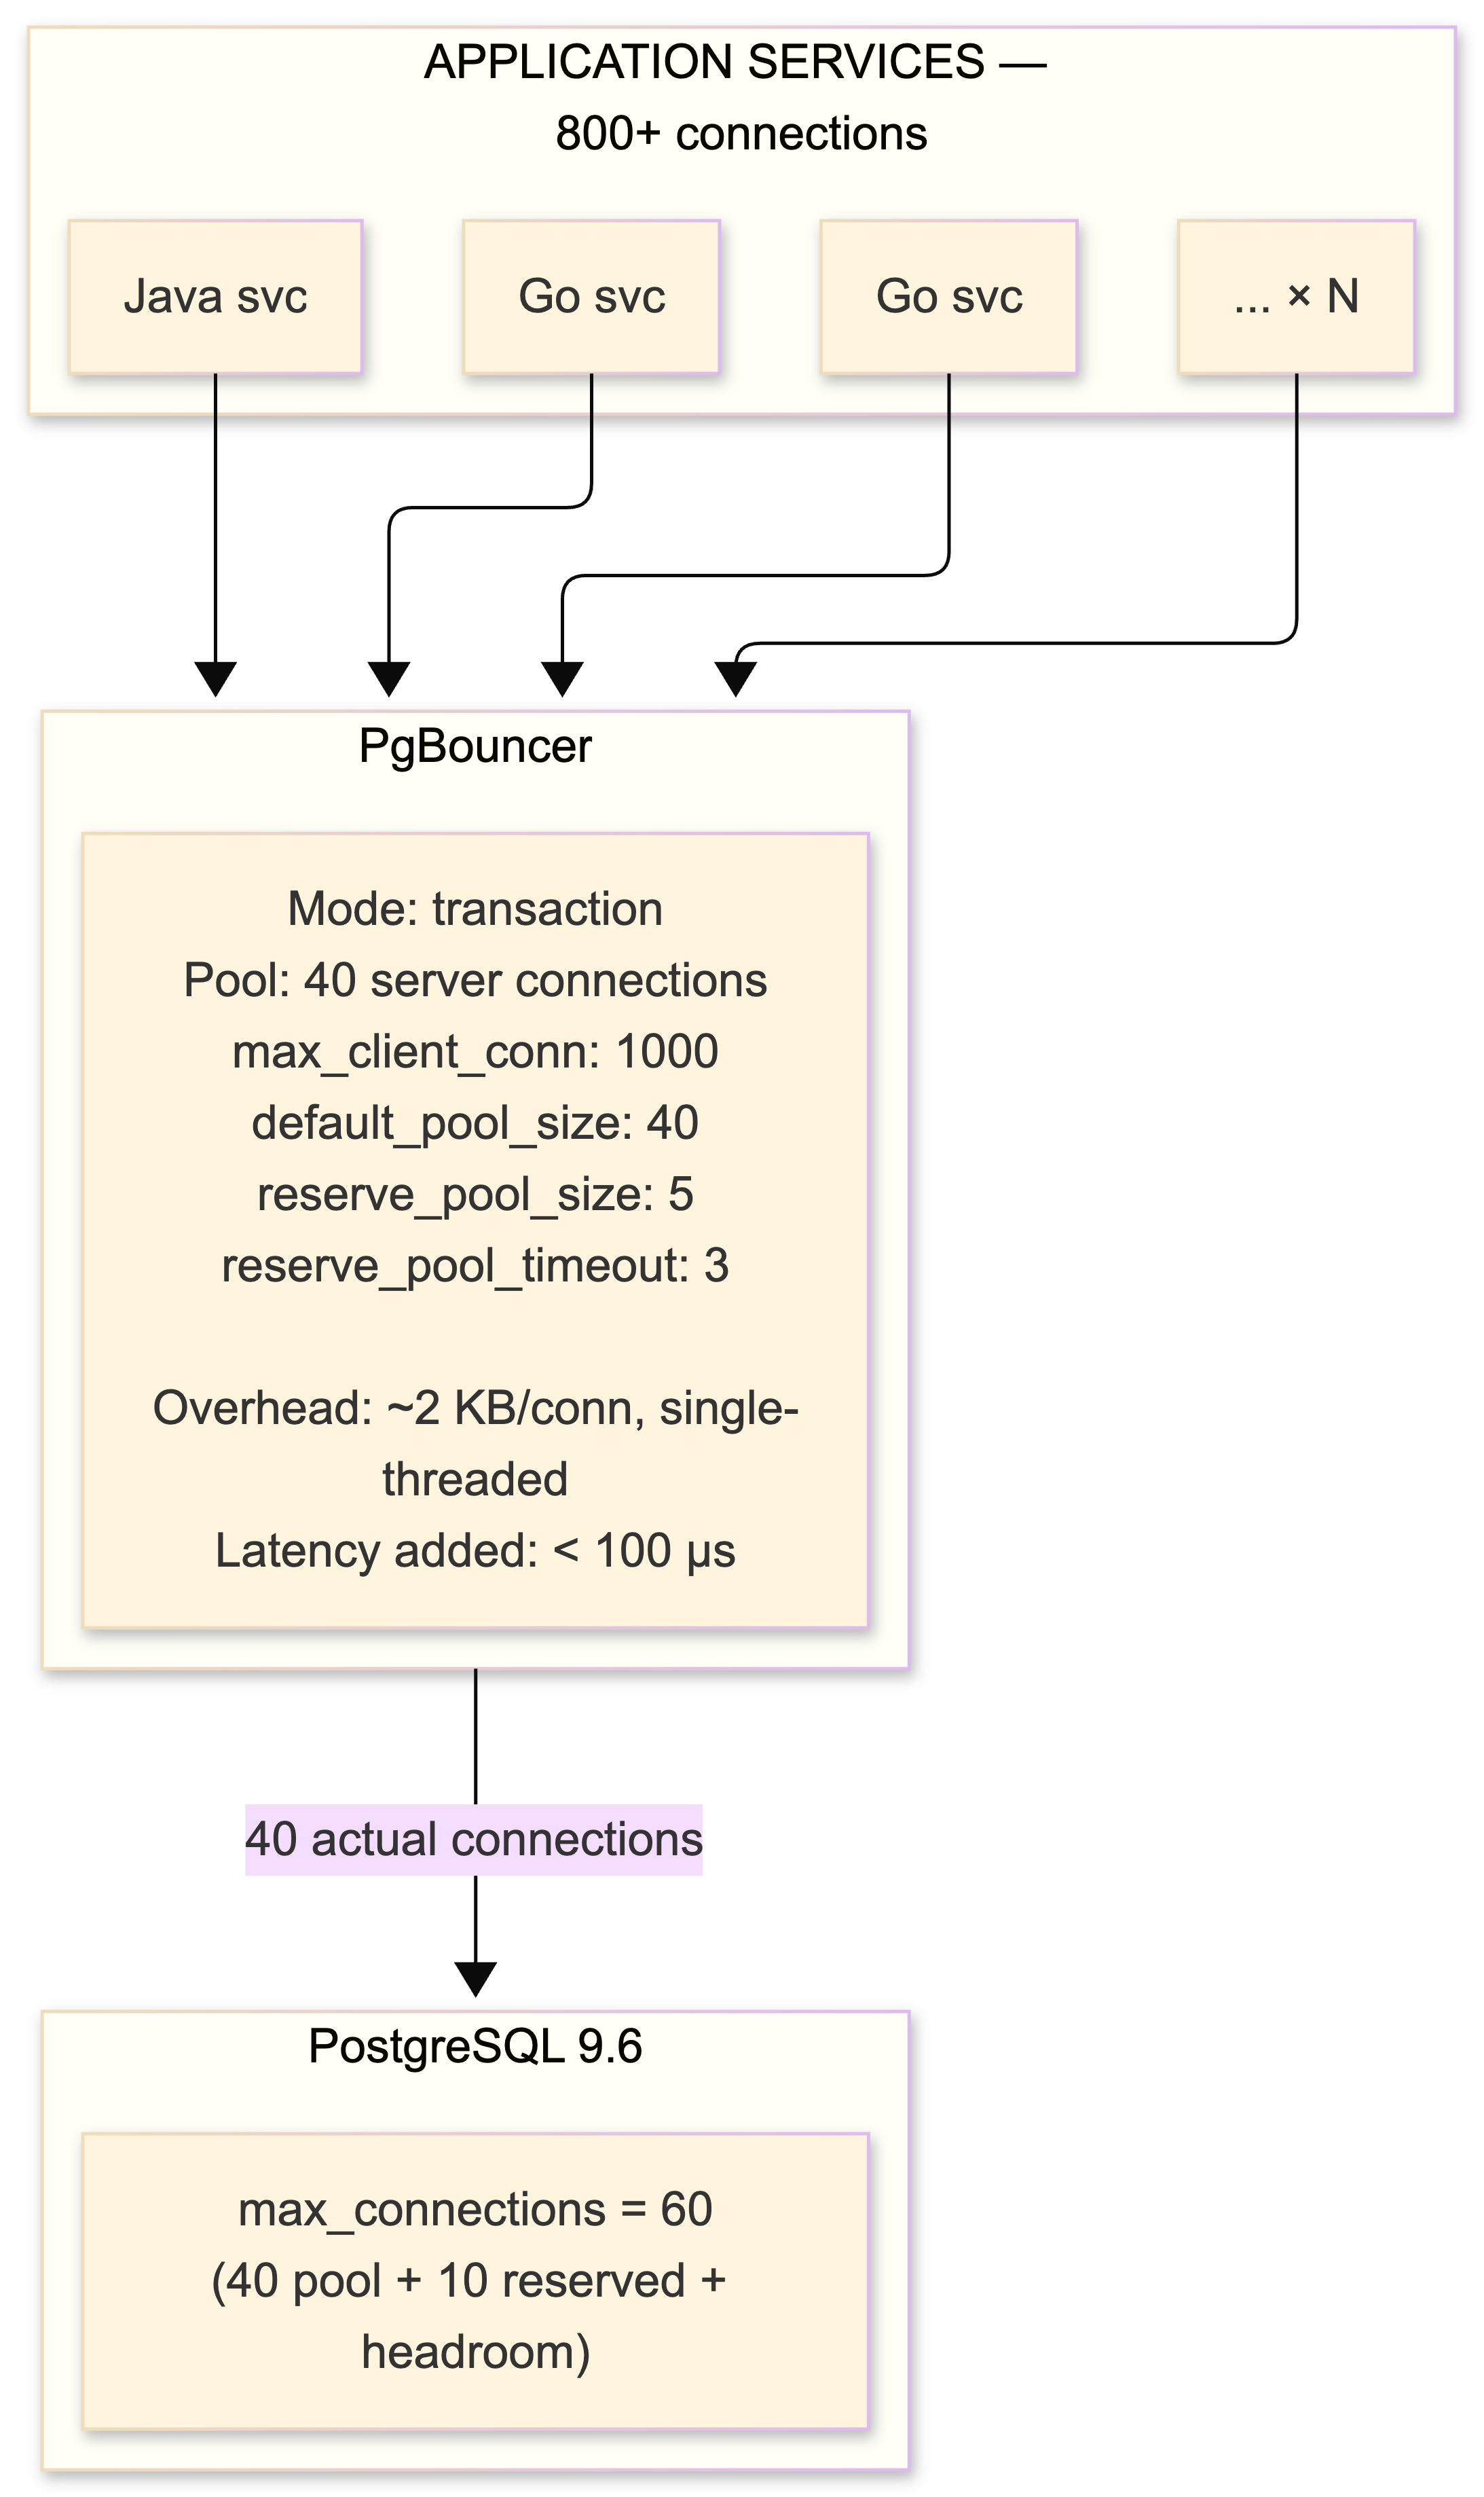
Here's the problem. PostgreSQL forks a new OS process for every connection. Each one consumes 5–10 MB of RAM. Our trading platform runs dozens of microservices in Go and Java, each maintaining its own connection pool. Without centralized pooling, 400+ application threads would consume 4 GB of RAM in connection overhead alone and saturate PostgreSQL's process management before we even get to the actual queries.
PgBouncer in transaction mode maintains a pool of 40 persistent backend connections serving over 800 concurrent client connections. Sub-millisecond overhead per transaction handoff. The math works because most clients are idle at any given moment - waiting on network I/O, processing results, or sitting between trades.
The catch - and there is always a catch with PgBouncer in transaction mode: prepared statements that persist across transactions are broken. We had to disable prepare_threshold in our JDBC drivers and set prepare: false in our Go services (we use pgx with explicit query mode). Temporary tables must be created with ON COMMIT DROP. SET commands don't persist. LISTEN/NOTIFY is completely unusable. Advisory locks that span transactions are unreliable. Every single one of these bit us at least once before we codified the rules into our development guidelines and code review checklist.
We evaluated pgpool-II early on for its load-balancing and failover capabilities, but found its multi-process architecture and SQL parsing overhead added measurable latency. For pure connection pooling, PgBouncer benchmarks roughly 75% faster. We handle read/write routing and failover with Patroni and HAProxy instead. The right tool for each job.
Key PgBouncer metrics we watch via Prometheus:
-- Connect to PgBouncer's admin console
SHOW POOLS;
SHOW STATS;
We alert on: cl_waiting sustained above zero (pool undersized), avg_wait_time climbing (backpressure building), sv_idle consistently high (overprovisioned). Expose these via pgbouncer_exporter into Prometheus. If you're running PgBouncer without monitoring, you're running blind.
Taming the Vacuum: MVCC Will Eat You Alive at Scale
If PgBouncer was the biggest win, autovacuum tuning was the most painful lesson. PostgreSQL's Multi-Version Concurrency Control is elegant in theory and absolutely treacherous at scale if you don't understand what it's doing under the hood.
Every UPDATE creates a new tuple version. The old one becomes a dead tuple - invisible to new transactions but physically present on disk, consuming space and degrading sequential scan performance. Every DELETE marks a tuple dead but reclaims nothing. Autovacuum is responsible for cleaning this up, and its default configuration is calibrated for a modest write rate that has nothing in common with a trading platform.
The defaults: autovacuum_vacuum_scale_factor = 0.2 means vacuum won't trigger until 20% of a table's rows are dead. On our orders table with 50 million rows, that's 10 million dead tuples before vacuum even wakes up. Unacceptable.
Here's what we actually run on our hottest tables:
ALTER TABLE orders SET (
    autovacuum_vacuum_scale_factor = 0.02,
    autovacuum_analyze_scale_factor = 0.01,
    autovacuum_vacuum_cost_delay = 2,
    autovacuum_vacuum_cost_limit = 1500
);

ALTER TABLE trades SET (
    autovacuum_vacuum_scale_factor = 0.02,
    autovacuum_analyze_scale_factor = 0.01,
    autovacuum_vacuum_cost_delay = 2,
    autovacuum_vacuum_cost_limit = 1500
);

ALTER TABLE positions SET (
    autovacuum_vacuum_scale_factor = 0.05,
    autovacuum_analyze_scale_factor = 0.02,
    autovacuum_vacuum_cost_delay = 2
);
Global settings:
# postgresql.conf - autovacuum section
autovacuum_naptime = 15s              # default 60s, check more often
autovacuum_max_workers = 6            # default 3, more concurrent vacuum ops
autovacuum_vacuum_cost_delay = 2ms    # default 20ms, dramatically less throttling
autovacuum_vacuum_cost_limit = 1500   # default 200, more work per cycle
The philosophy: vacuum frequently in small batches. A vacuum processing 100,000 dead tuples every 30 seconds has negligible impact on query performance. A vacuum processing 10 million dead tuples after hours of accumulation will spike I/O and cause visible latency on production queries. I've seen this firsthand. It's not fun explaining to traders why their order book refreshes are lagging because vacuum decided to eat the entire I/O budget.
The Incident That Aged Me Five Years
The most dangerous pattern we encountered: a single long-running analytical query on the primary prevented vacuum from reclaiming dead tuples on every table it touched. MVCC requires keeping old tuple versions visible to any transaction that might still need them. A reporting query that someone left running overnight - an idle in transaction session open for 8 hours - caused our trades table to balloon from 12 GB to 40 GB before we noticed.
PostgreSQL 9.6's idle_in_transaction_session_timeout is now set to 300 seconds on every production instance. Non-negotiable.
idle_in_transaction_session_timeout = '300s'
statement_timeout = '1800s'  # 30 minutes, primary only
We also monitor pg_stat_user_tables.n_dead_tup and alert when the dead-to-live ratio exceeds 10%:
SELECT
    schemaname,
    relname,
    n_live_tup,
    n_dead_tup,
    round(n_dead_tup::numeric / greatest(n_live_tup, 1) * 100, 2) AS dead_pct,
    last_autovacuum,
    last_autoanalyze
FROM pg_stat_user_tables
WHERE n_dead_tup > 10000
ORDER BY n_dead_tup DESC;
When bloat does accumulate despite your best efforts, VACUUM FULL requires an ACCESS EXCLUSIVE lock - which means the entire table is offline. Completely unacceptable on a live trading system. pg_repack has saved us multiple times, performing online table reorganization by creating a shadow copy, replaying changes via a trigger, and atomically swapping the tables. It requires roughly 2x the table's disk space temporarily and holds an exclusive lock only for the brief catalog swap at the end. Keep it in your toolkit.
Transaction ID Wraparound: The Silent Killer
This is the PostgreSQL failure mode that keeps me up at night. PostgreSQL uses 32-bit transaction IDs, and after approximately 2 billion transactions, the counter wraps around. If vacuum hasn't frozen old rows before this happens, PostgreSQL enters protective read-only mode to prevent data corruption. Mandrill had a 40-hour outage in 2016 from exactly this scenario.
We came within 50 million transactions of our own wraparound incident in our first year. Root cause: that same overnight reporting query holding a transaction open and preventing autovacuum from freezing old tuples. The age(relfrozenxid) on the orders table was climbing toward the autovacuum_freeze_max_age threshold of 200 million.
Monitor this. I'm not kidding. This goes in your critical alerting:
SELECT
    c.oid::regclass AS table_name,
    age(c.relfrozenxid) AS xid_age,
    pg_size_pretty(pg_total_relation_size(c.oid)) AS total_size
FROM pg_class c
JOIN pg_namespace n ON c.relnamespace = n.oid
WHERE c.relkind = 'r'
  AND n.nspname NOT IN ('pg_catalog', 'information_schema')
ORDER BY age(c.relfrozenxid) DESC
LIMIT 20;
Alert at 150 million. Page at 200 million. Do not wait.
Schema Design Patterns That Actually Work for Trading
The orders table is the hottest table in any trading system. Orders transition through states - NEW, PARTIAL, FILLED, CANCELLED - with each transition triggering an UPDATE. In a naive schema, this creates severe table bloat as MVCC generates dead tuples with every state change.
Two techniques transformed our order table performance.
FILLFACTOR and HOT Updates
We set FILLFACTOR to 70 on the orders table, reserving 30% of each 8 KB page as free space. This enables PostgreSQL's HOT (Heap-Only Tuple) updates. When an update modifies no indexed columns and free space exists in the current page, PostgreSQL can update the row in-place without touching any indexes. For our order status transitions - which change only status, filled_quantity, and updated_at, none of which are indexed - HOT updates eliminate the write amplification that Uber complained about. This is a huge deal. Adyen (the payment processor) documented a 30% immediate throughput improvement from FILLFACTOR tuning alone.
CREATE TABLE orders (
    order_id      bigserial PRIMARY KEY,
    account_id    bigint NOT NULL,
    instrument_id integer NOT NULL,
    order_type    smallint NOT NULL,    -- 1=LIMIT, 2=MARKET, 3=STOP
    side          smallint NOT NULL,    -- 1=BUY, 2=SELL
    quantity      numeric(18,8) NOT NULL,
    price         numeric(18,8),
    status        smallint NOT NULL DEFAULT 1,
    created_at    timestamptz NOT NULL DEFAULT now(),
    updated_at    timestamptz NOT NULL DEFAULT now(),
    filled_qty    numeric(18,8) NOT NULL DEFAULT 0
) WITH (
    fillfactor = 70,
    autovacuum_vacuum_scale_factor = 0.02,
    autovacuum_analyze_scale_factor = 0.01
);
Note the smallint for status, side, and order_type rather than varchar or enum. In a table with 50 million rows, the difference between a 2-byte smallint and a variable-length string adds up fast in both storage and comparison cost. Map them in the application layer. Your Go structs and Java enums can handle the translation.
Partial Indexes
At any given moment, fewer than 1% of orders are active (NEW or PARTIAL). A full index on (instrument_id, price) across all 50 million historical orders is wasteful. Instead:
-- Only indexes active orders. Tiny. Fast. Beautiful.
CREATE INDEX idx_active_orders
    ON orders (instrument_id, price)
    WHERE status IN (1, 2);  -- NEW, PARTIAL only

-- Historical lookups for compliance and reporting
CREATE INDEX idx_orders_account_history
    ON orders (account_id, created_at DESC);

-- Fill processing
CREATE INDEX idx_orders_pending_fills
    ON orders (order_id)
    WHERE status = 2;  -- PARTIAL only, waiting for fills
The active order index is a few megabytes versus gigabytes for a full index. Every query against the active order book uses it. Historical queries hit the account history index on read replicas. Clean separation.
Advisory Locks for Trade Execution
For trade execution, we wrap the entire fill process in a PL/pgSQL function that acquires advisory locks on both the buy and sell order IDs. This prevents concurrent fills of the same order pair. The function inserts the trade record, updates both orders' fill quantities and statuses, and adjusts account positions - all within a single transaction.
CREATE OR REPLACE FUNCTION execute_fill(
    p_buy_order_id  bigint,
    p_sell_order_id bigint,
    p_fill_qty      numeric(18,8),
    p_fill_price    numeric(18,8)
) RETURNS void AS $$
DECLARE
    v_buy_remaining  numeric(18,8);
    v_sell_remaining numeric(18,8);
BEGIN
    -- Transaction-scoped locks: released on COMMIT
    -- Works correctly through PgBouncer transaction pooling
    PERFORM pg_advisory_xact_lock(p_buy_order_id);
    PERFORM pg_advisory_xact_lock(p_sell_order_id);

    -- Update buy order
    UPDATE orders SET
        filled_qty = filled_qty + p_fill_qty,
        status = CASE
            WHEN filled_qty + p_fill_qty >= quantity THEN 3  -- FILLED
            ELSE 2  -- PARTIAL
        END,
        updated_at = now()
    WHERE order_id = p_buy_order_id
    RETURNING quantity - filled_qty INTO v_buy_remaining;

    -- Update sell order
    UPDATE orders SET
        filled_qty = filled_qty + p_fill_qty,
        status = CASE
            WHEN filled_qty + p_fill_qty >= quantity THEN 3  -- FILLED
            ELSE 2  -- PARTIAL
        END,
        updated_at = now()
    WHERE order_id = p_sell_order_id
    RETURNING quantity - filled_qty INTO v_sell_remaining;

    -- Insert trade record
    INSERT INTO trades (buy_order_id, sell_order_id, quantity, price, executed_at)
    VALUES (p_buy_order_id, p_sell_order_id, p_fill_qty, p_fill_price, now());

    -- Update positions (omitted for brevity, but same transaction)
END;
$$ LANGUAGE plpgsql;
Critical detail: we use pg_advisory_xact_lock (transaction-scoped), not pg_advisory_lock (session-scoped). Session-scoped advisory locks are unreliable through PgBouncer in transaction mode because sessions are recycled. This was one of those bugs that showed up only under load during testing. Nasty.
Market Data at Scale: BRIN Indexes and Partitioning
Market data is a completely different beast from transactional order data. It's append-only, time-ordered, and voluminous - we ingest roughly 200,000 ticks per second during active market hours across all instruments. The access pattern is almost exclusively "give me all ticks for instrument X between time A and time B."
BRIN Indexes Changed Everything
BRIN (Block Range Index) indexes, introduced in PostgreSQL 9.5, store summary information (min/max values) for ranges of physical table blocks rather than indexing every row. For our tick data, where rows are naturally ordered by insertion time, a BRIN index on timestamp occupies 4.8 MB versus 214 MB for an equivalent B-tree. That's a 45x reduction in index size.
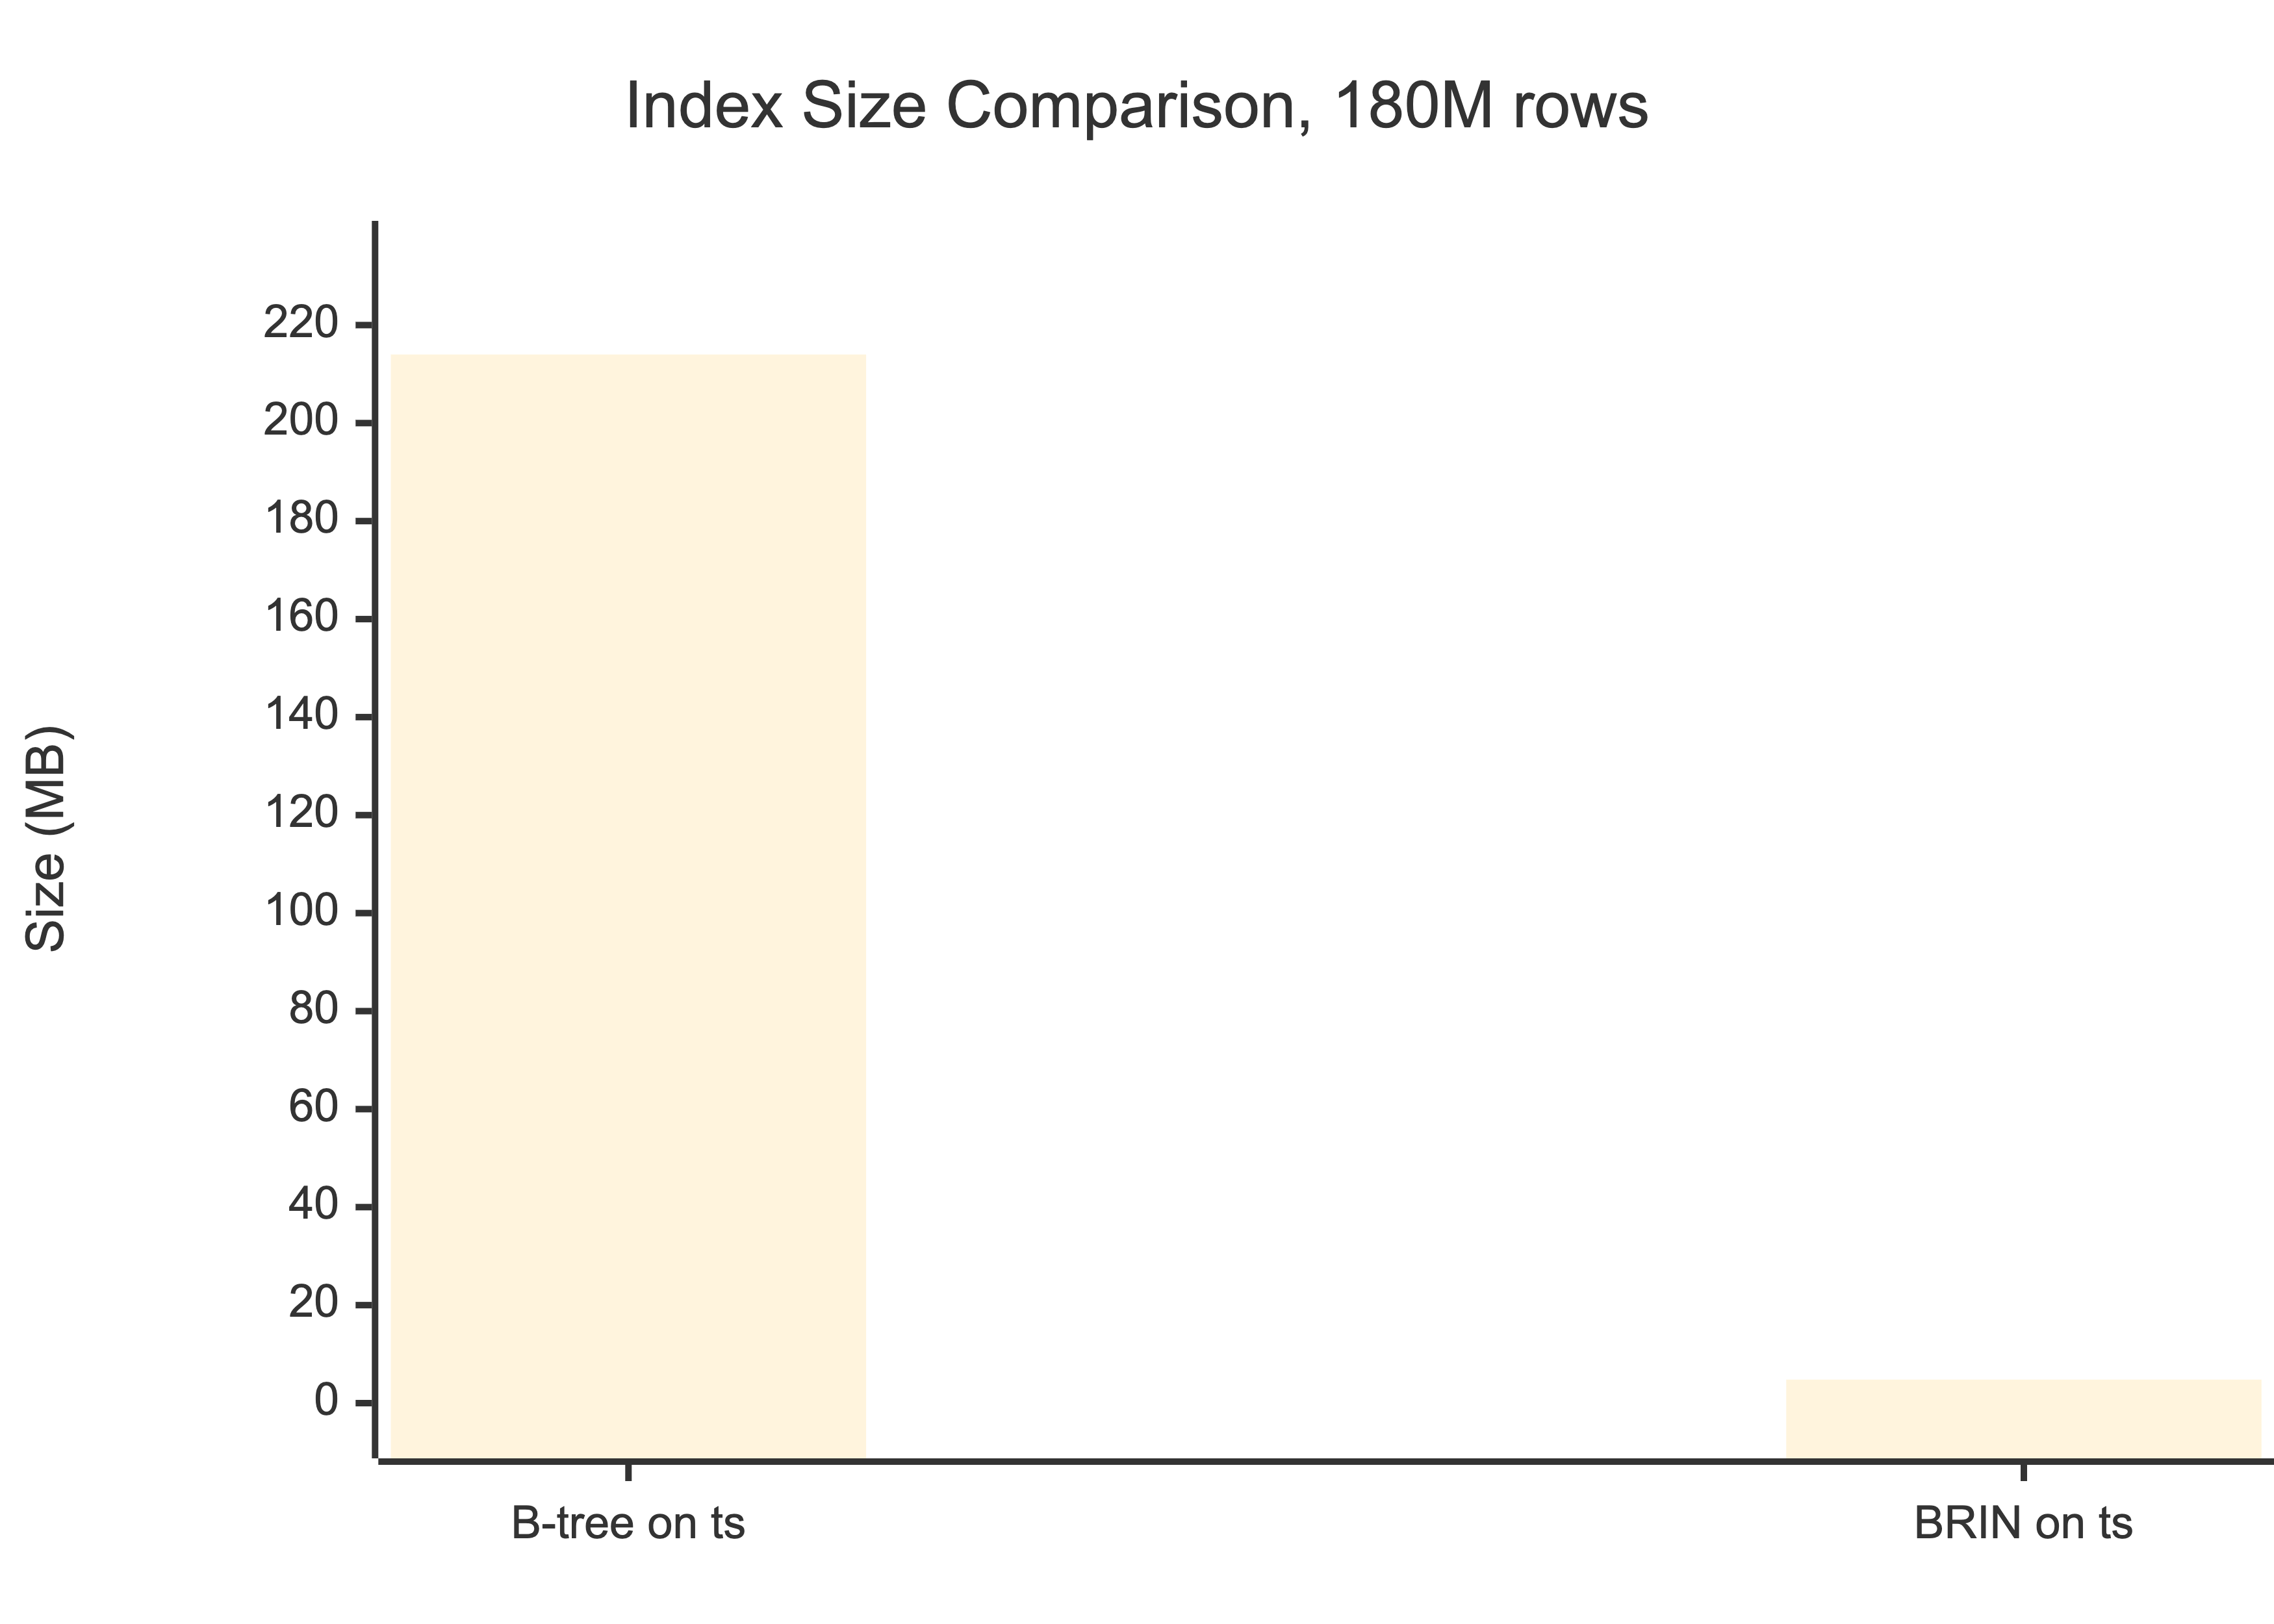
Query speed (range scan, 1 day): B-tree: ~2ms | BRIN: ~47ms
For analytical queries over market data, 47ms is fine. The space savings mean the entire BRIN index fits in shared_buffers with room to spare.
The trade-off is query speed: BRIN returns results in ~47ms versus ~2ms for B-tree. For analytical queries over historical market data, 47ms is perfectly acceptable. For real-time order book lookups, use B-tree. Know your access patterns.
Inheritance-Based Partitioning (The Pre-PG10 Way)
We partition tick data by date using inheritance-based partitioning. We started before PostgreSQL 10's declarative syntax was available, so this is the battle-tested approach. Each trading day gets its own child table with a CHECK constraint on the timestamp column.
-- Parent table (holds no data directly)
CREATE TABLE tick_data (
    instrument_id integer NOT NULL,
    ts            timestamptz NOT NULL,
    price         numeric(18,8) NOT NULL,
    volume        bigint NOT NULL
);

-- Daily partition
CREATE TABLE tick_data_20171015 (
    CHECK (ts >= '2017-10-15' AND ts < '2017-10-16')
) INHERITS (tick_data);

-- BRIN index per partition, 1 page per range for maximum granularity
CREATE INDEX ON tick_data_20171015 USING brin (ts) WITH (pages_per_range = 1);
CREATE INDEX ON tick_data_20171015 (instrument_id, ts);

-- Trigger-based routing on parent
CREATE OR REPLACE FUNCTION tick_data_insert_trigger()
RETURNS TRIGGER AS $$
BEGIN
    EXECUTE format(
        'INSERT INTO tick_data_%s VALUES ($1.*)',
        to_char(NEW.ts, 'YYYYMMDD')
    ) USING NEW;
    RETURN NULL;
END;
$$ LANGUAGE plpgsql;

CREATE TRIGGER insert_tick_data_trigger
    BEFORE INSERT ON tick_data
    FOR EACH ROW EXECUTE PROCEDURE tick_data_insert_trigger();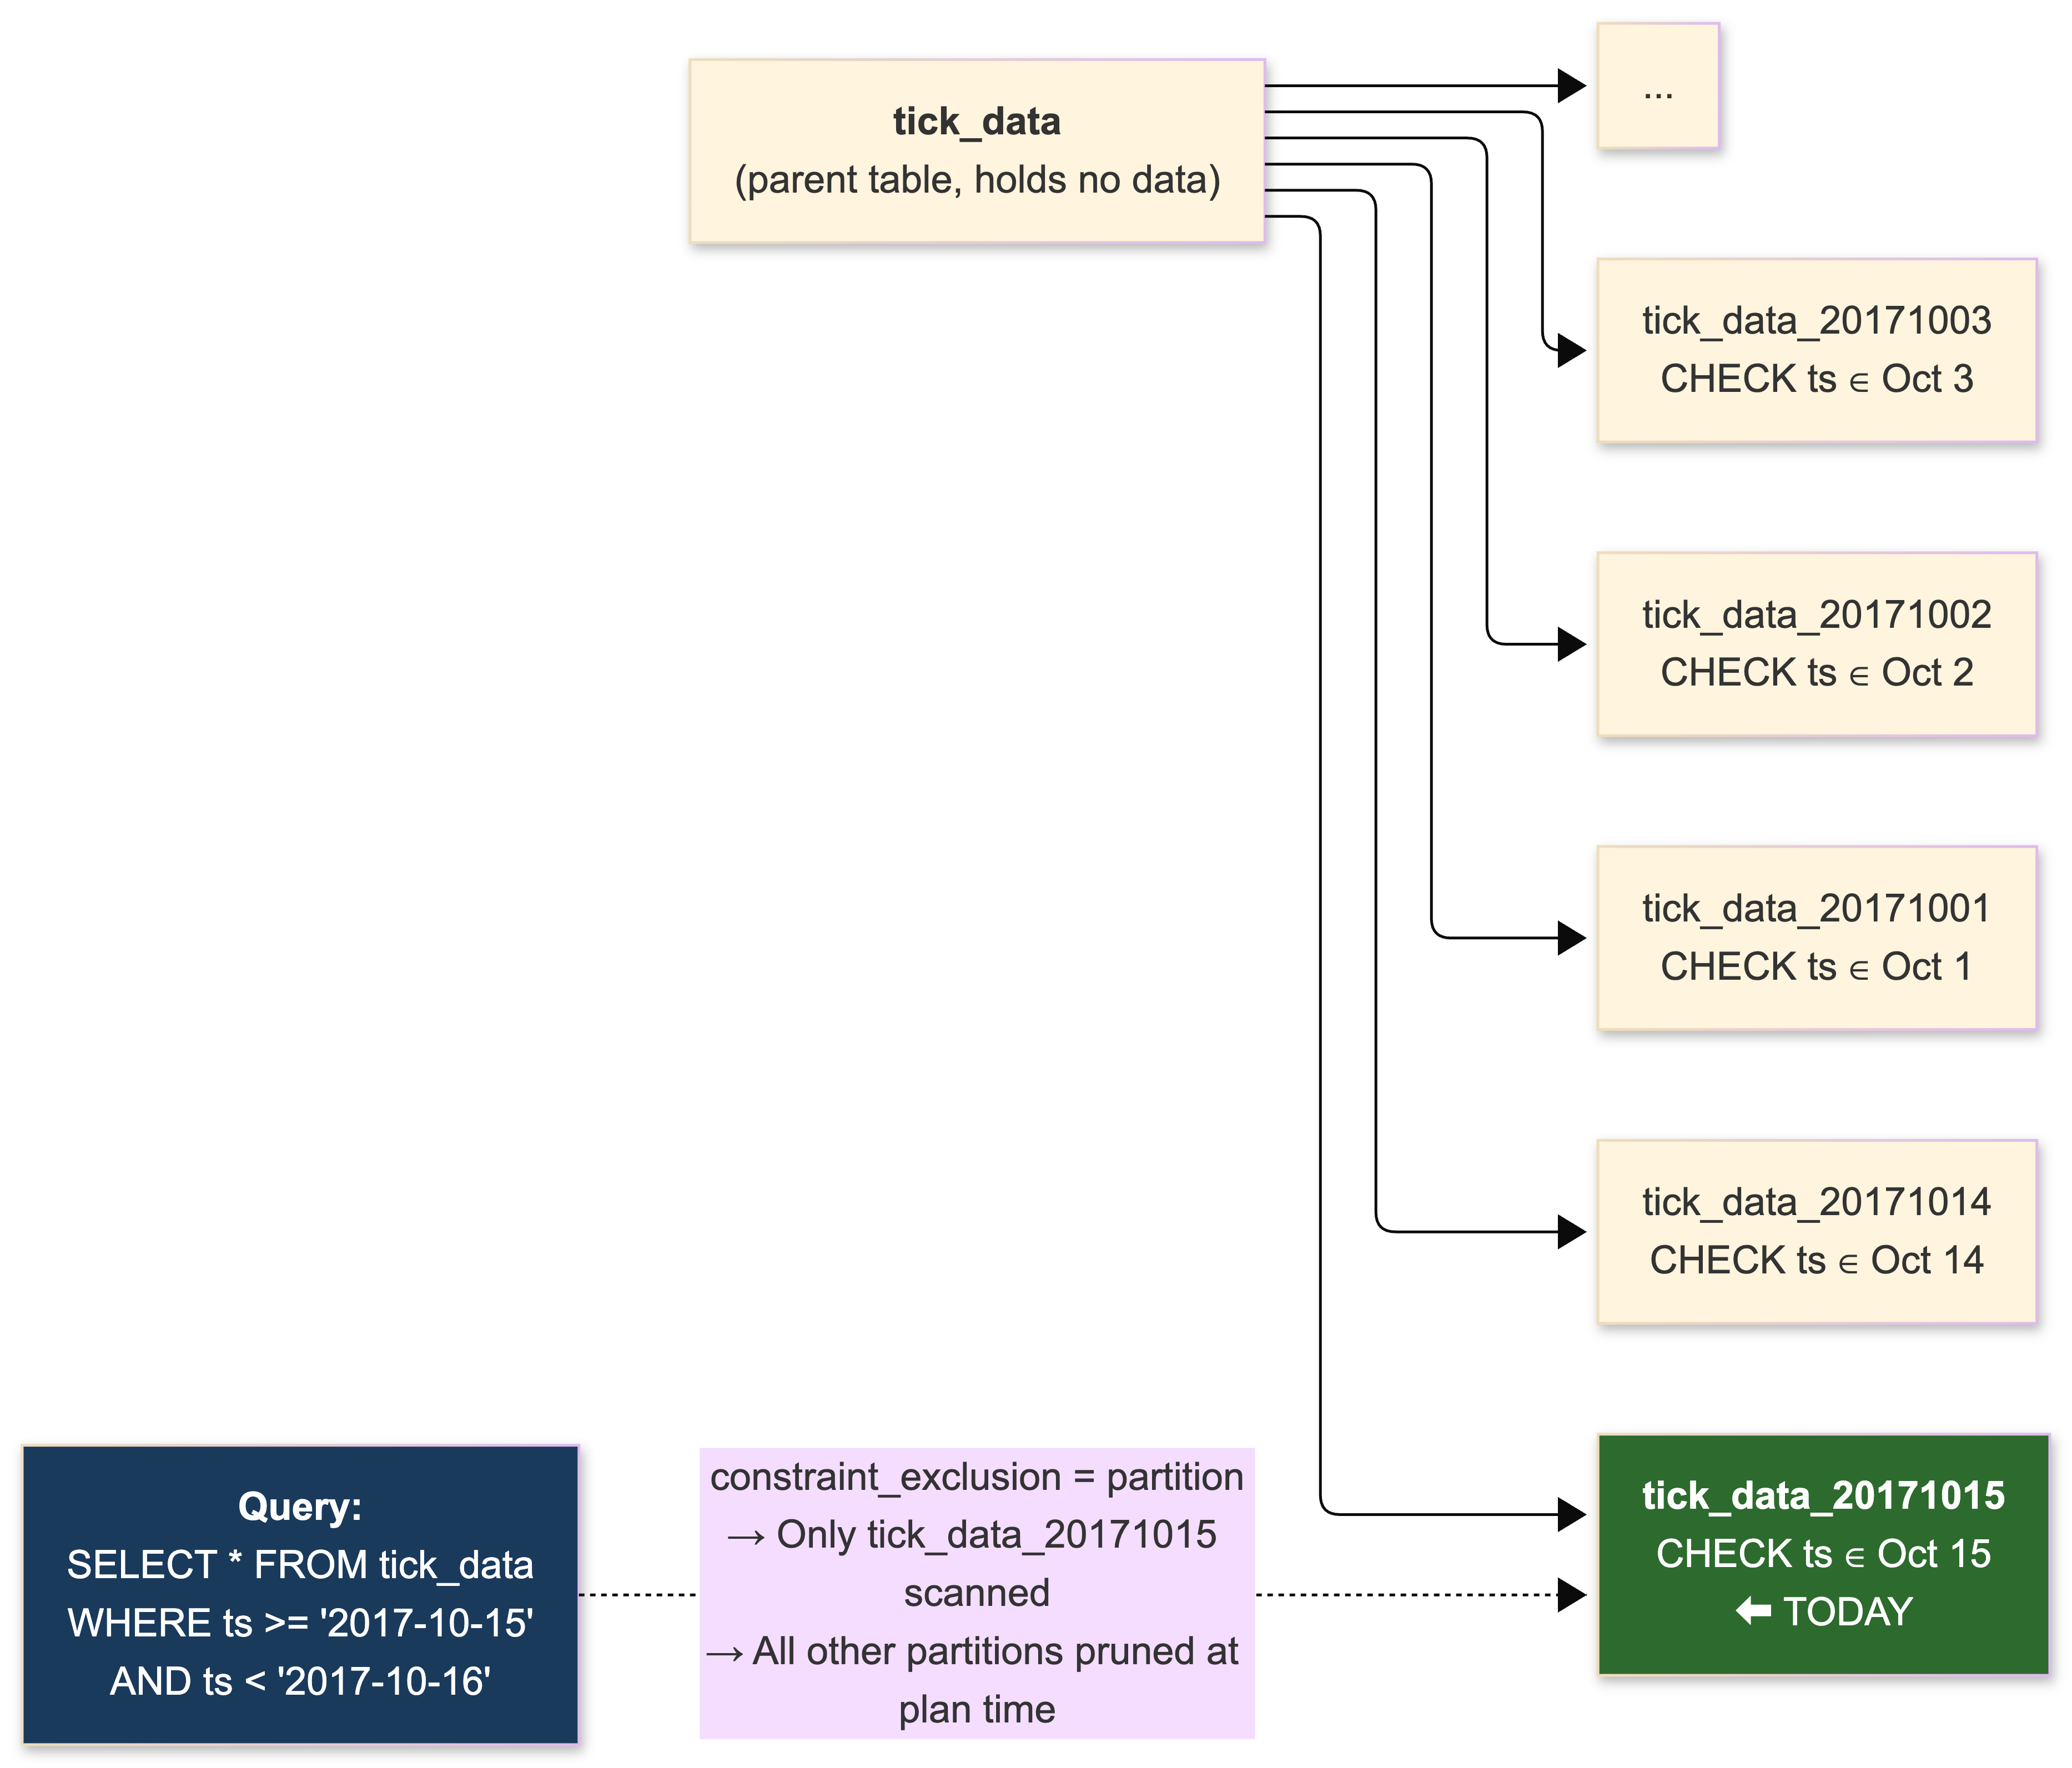
Data retention:
DROP TABLE tick_data_20170901;- instant, no vacuum needed.
This approach has real limitations. The trigger-based routing adds overhead to every INSERT - on a high-ingest pipeline, this is measurable. Constraint exclusion is O(N) in the number of partitions, so planning time degrades as partitions accumulate; we keep the count under 60 by archiving old data. INSERT ... ON CONFLICT doesn't work correctly across the partition set. Cross-partition UPDATE that changes the partition key just fails against the CHECK constraint.
We use pg_partman to automate child table creation and retention. Its background worker handles creating future partitions and dropping expired ones without external cron jobs. For tick data, partitions are daily; for trade history, monthly. The key insight: partition granularity should match your most common query pattern. If 90% of your queries filter to "today's data," daily partitions minimize the data scanned.
For bulk ingestion, COPY is dramatically faster than individual INSERT statements. Our Go market data consumers batch ticks into 1,000-row chunks and stream them via COPY FROM STDIN using the pgx driver's copy protocol support. On our hardware, this sustains 220,000 inserts/second during peak hours.
PostgreSQL 10's Declarative Partitioning
We're migrating to PG10's declarative syntax in staging right now:
-- PG10 declarative partitioning - cleaner, faster, no triggers
CREATE TABLE tick_data (
    instrument_id integer NOT NULL,
    ts            timestamptz NOT NULL,
    price         numeric(18,8) NOT NULL,
    volume        bigint NOT NULL
) PARTITION BY RANGE (ts);

CREATE TABLE tick_data_20171015
    PARTITION OF tick_data
    FOR VALUES FROM ('2017-10-15') TO ('2017-10-16');
No triggers. Internal tuple routing at O(log N) instead of O(N) constraint exclusion. Early benchmarks show measurably faster INSERT throughput. The initial implementation has limitations - no automatic index creation on new partitions, no foreign keys referencing partitioned tables, no hash partitioning yet (expected in PG 11). But the foundation is solid, and I expect we'll be fully migrated by Q1 2018.
Performance Tuning: The Configuration That Actually Matters
PostgreSQL ships with defaults calibrated for a shared hosting environment in the early 2000s - 128 MB of shared_buffers. On a dedicated trading database server with 256 GB of RAM and NVMe storage, nearly every default is wrong. Here's what we actually run and why.
postgresql.conf - The Settings That Moved the Needle
# ──────────────────────────────────────────
# MEMORY
# ──────────────────────────────────────────
shared_buffers = 64GB                 # 25% of 256GB RAM
effective_cache_size = 192GB          # 75% of RAM, planner hint
work_mem = 16MB                       # per sort/hash operation, NOT per connection
maintenance_work_mem = 2GB            # for VACUUM, CREATE INDEX
huge_pages = on                       # reduces TLB misses at this buffer size

# ──────────────────────────────────────────
# WAL
# ──────────────────────────────────────────
wal_level = replica                   # required for streaming replication
max_wal_size = 8GB                    # default 1GB, way too small
min_wal_size = 2GB                    # prevents WAL segment churn
checkpoint_completion_target = 0.9    # spread checkpoint I/O over 90% of interval
checkpoint_timeout = 15min            # most checkpoints should be time-driven
wal_compression = on                  # ~30% WAL reduction, negligible CPU cost
wal_buffers = 64MB                    # auto-tuned, but explicit for clarity

# ──────────────────────────────────────────
# PLANNER
# ──────────────────────────────────────────
random_page_cost = 1.1                # NVMe SSDs, not spinning disks
effective_io_concurrency = 200        # NVMe supports high concurrency
default_statistics_target = 200       # better planner estimates on skewed data

# ──────────────────────────────────────────
# CONNECTIONS
# ──────────────────────────────────────────
max_connections = 60                  # PgBouncer handles the multiplexing
Let me explain the ones that trip people up.
shared_buffers = 64GB - 25% of total RAM. PostgreSQL uses this as its own buffer cache but also relies on the OS page cache for the remainder. Going above 40% is counterproductive due to double-buffering effects. The huge_pages = on requires configuring vm.nr_hugepages in the kernel - for 64 GB, that's approximately 32,770 pages at 2 MB each plus headroom.
work_mem = 16MB - this is deceptively dangerous. It's allocated per sort or hash operation, not per connection, and not per query. A complex query with multiple joins and sorts can allocate this several times. With 40 active backends running analytical queries: worst case is 40 × 4 × 16 MB = 2.5 GB. We keep it conservative on the primary and bump it for batch processing:
-- On read replicas, for end-of-day risk calculations
SET LOCAL work_mem = '256MB';
SELECT ... complex aggregation ...;
random_page_cost = 1.1 - the default of 4.0 assumes spinning disks where random I/O is ~4x slower than sequential. On NVMe SSDs, random and sequential reads are nearly equivalent. Leaving this at default caused the planner to avoid index scans on tables where they were clearly optimal. This single change improved several of our query plans dramatically.
max_wal_size = 8GB - controls how much WAL accumulates before triggering a checkpoint. The default 1 GB causes excessively frequent checkpoints on write-heavy workloads. We monitor via pg_stat_bgwriter: the checkpoints_req (forced by WAL size) should be near zero relative to checkpoints_timed (forced by timeout). If you see forced checkpoints, increase this.
OS-Level Tuning (CentOS 7)
This stuff matters as much as the PostgreSQL config. Don't skip it.
# /etc/sysctl.conf

# Don't swap. Ever. We'd rather OOM than swap on a trading system.
vm.swappiness = 1

# Prevent OOM killer from targeting PostgreSQL
vm.overcommit_memory = 2
vm.overcommit_ratio = 85

# Aggressive dirty page flushing
vm.dirty_ratio = 5
vm.dirty_background_ratio = 2

# Huge pages for PostgreSQL
# Calculate: shared_buffers / 2MB hugepage size + headroom
vm.nr_hugepages = 33000
# Disable transparent huge pages - causes 50-100ms latency spikes
echo never > /sys/kernel/mm/transparent_hugepage/enabled
echo never > /sys/kernel/mm/transparent_hugepage/defrag
# NVMe SSD I/O scheduler - noop or none
echo none > /sys/block/nvme0n1/queue/scheduler
# XFS filesystem with noatime
# In /etc/fstab:
# /dev/nvme0n1p1 /pgdata xfs defaults,noatime,nodiratime 0 0
The THP (Transparent Huge Pages) issue deserves special emphasis. THP caused latency spikes of 50–100ms in our early testing - completely unacceptable for a trading system. The kernel's background compaction daemon (khugepaged) periodically defragments memory to create huge pages, and this process stalls allocations. Disable it. Use static huge pages via vm.nr_hugepages instead. This is one of those things that's documented everywhere but people still forget, and then they spend three weeks debugging intermittent latency that only shows up under load. Ask me how I know.
Replication and High Availability
We run synchronous streaming replication to two standbys with remote_apply mode. This means every commit waits for at least one synchronous standby to apply the WAL (not just receive it), adding 0.5–2ms per transaction within our data center. We accept this overhead because the alternative - promoting an asynchronous standby after a primary failure and losing the last few hundred milliseconds of transactions - is unacceptable for financial data.
Streaming Replication Setup
On the primary (postgresql.conf):
wal_level = replica
max_wal_senders = 10
max_replication_slots = 10
synchronous_standby_names = 'FIRST 1 (standby1, standby2)'
synchronous_commit = remote_apply
hot_standby = on
On each standby (recovery.conf for PG 9.6):
standby_mode = 'on'
primary_conninfo = 'host=primary port=5432 user=replicator application_name=standby1'
primary_slot_name = 'standby1_slot'
recovery_target_timeline = 'latest'
Replication slots without monitoring are a ticking bomb. A standby that goes offline causes WAL to accumulate indefinitely on the primary until the disk fills. We alert when any slot's lag exceeds 1 GB:
SELECT
    slot_name,
    slot_type,
    active,
    pg_wal_lsn_diff(pg_current_wal_lsn(), restart_lsn) AS lag_bytes,
    pg_size_pretty(pg_wal_lsn_diff(pg_current_wal_lsn(), restart_lsn)) AS lag_pretty
FROM pg_replication_slots;
Patroni Configuration
Our Patroni setup (simplified):
# patroni.yml
scope: trading-cluster
namespace: /trading/

restapi:
  listen: 0.0.0.0:8008
  connect_address: ${NODE_IP}:8008

etcd:
  hosts: etcd1:2379,etcd2:2379,etcd3:2379

bootstrap:
  dcs:
    ttl: 30
    loop_wait: 10
    retry_timeout: 10
    maximum_lag_on_failover: 1048576  # 1 MB
    synchronous_mode: true
    postgresql:
      use_pg_rewind: true
      parameters:
        max_connections: 60
        max_wal_senders: 10
        wal_level: replica
        hot_standby: on
        synchronous_commit: remote_apply

  initdb:
    - encoding: UTF8
    - data-checksums

postgresql:
  listen: 0.0.0.0:5432
  connect_address: ${NODE_IP}:5432
  data_dir: /pgdata/main
  pgpass: /tmp/pgpass

  authentication:
    replication:
      username: replicator
      password: ${REPL_PASSWORD}
    superuser:
      username: postgres
      password: ${PG_PASSWORD}
HAProxy routes traffic based on Patroni's REST API:
# haproxy.cfg
frontend pg_write
    bind *:5432
    default_backend pg_primary

frontend pg_read
    bind *:5433
    default_backend pg_replicas

backend pg_primary
    option httpchk GET /primary
    http-check expect status 200
    server pg1 10.0.1.1:5432 check port 8008
    server pg2 10.0.1.2:5432 check port 8008
    server pg3 10.0.1.3:5432 check port 8008

backend pg_replicas
    option httpchk GET /replica
    http-check expect status 200
    balance roundrobin
    server pg4 10.0.1.4:5432 check port 8008
    server pg5 10.0.1.5:5432 check port 8008
    server pg6 10.0.1.6:5432 check port 8008
The Thundering Herd Problem
One scenario we didn't anticipate: connection storms after failover. When Patroni promotes a standby and HAProxy reroutes traffic, hundreds of application connections simultaneously attempt to establish new sessions with the new primary. Each connection fork consumes CPU and memory, and the thundering herd can overwhelm the freshly promoted server while it's still warming caches.
Our solution: PgBouncer absorbs the connection storm, queueing excess connections via reserve_pool_size and draining them gradually. We also added exponential backoff with jitter to our Go services' reconnection logic:
func reconnectWithBackoff(ctx context.Context, dsn string) (*pgx.Conn, error) {
    var conn *pgx.Conn
    backoff := 100 * time.Millisecond
    maxBackoff := 30 * time.Second

    for {
        var err error
        conn, err = pgx.Connect(ctx, dsn)
        if err == nil {
            return conn, nil
        }

        jitter := time.Duration(rand.Int63n(int64(backoff / 2)))
        sleep := backoff + jitter

        select {
        case <-ctx.Done():
            return nil, ctx.Err()
        case <-time.After(sleep):
        }

        backoff = backoff * 2
        if backoff > maxBackoff {
            backoff = maxBackoff
        }
    }
}
After failover, the old primary needs to rejoin the cluster as a standby. pg_rewind (available since 9.5) makes this fast by identifying and copying only the divergent WAL since the timeline fork, rather than requiring a full pg_basebackup resync. This reduced our re-integration time from over an hour to under five minutes. Patroni handles this automatically with use_pg_rewind: true.
The Monitoring Stack
You cannot operate PostgreSQL at scale without deep observability. Here's our full stack.
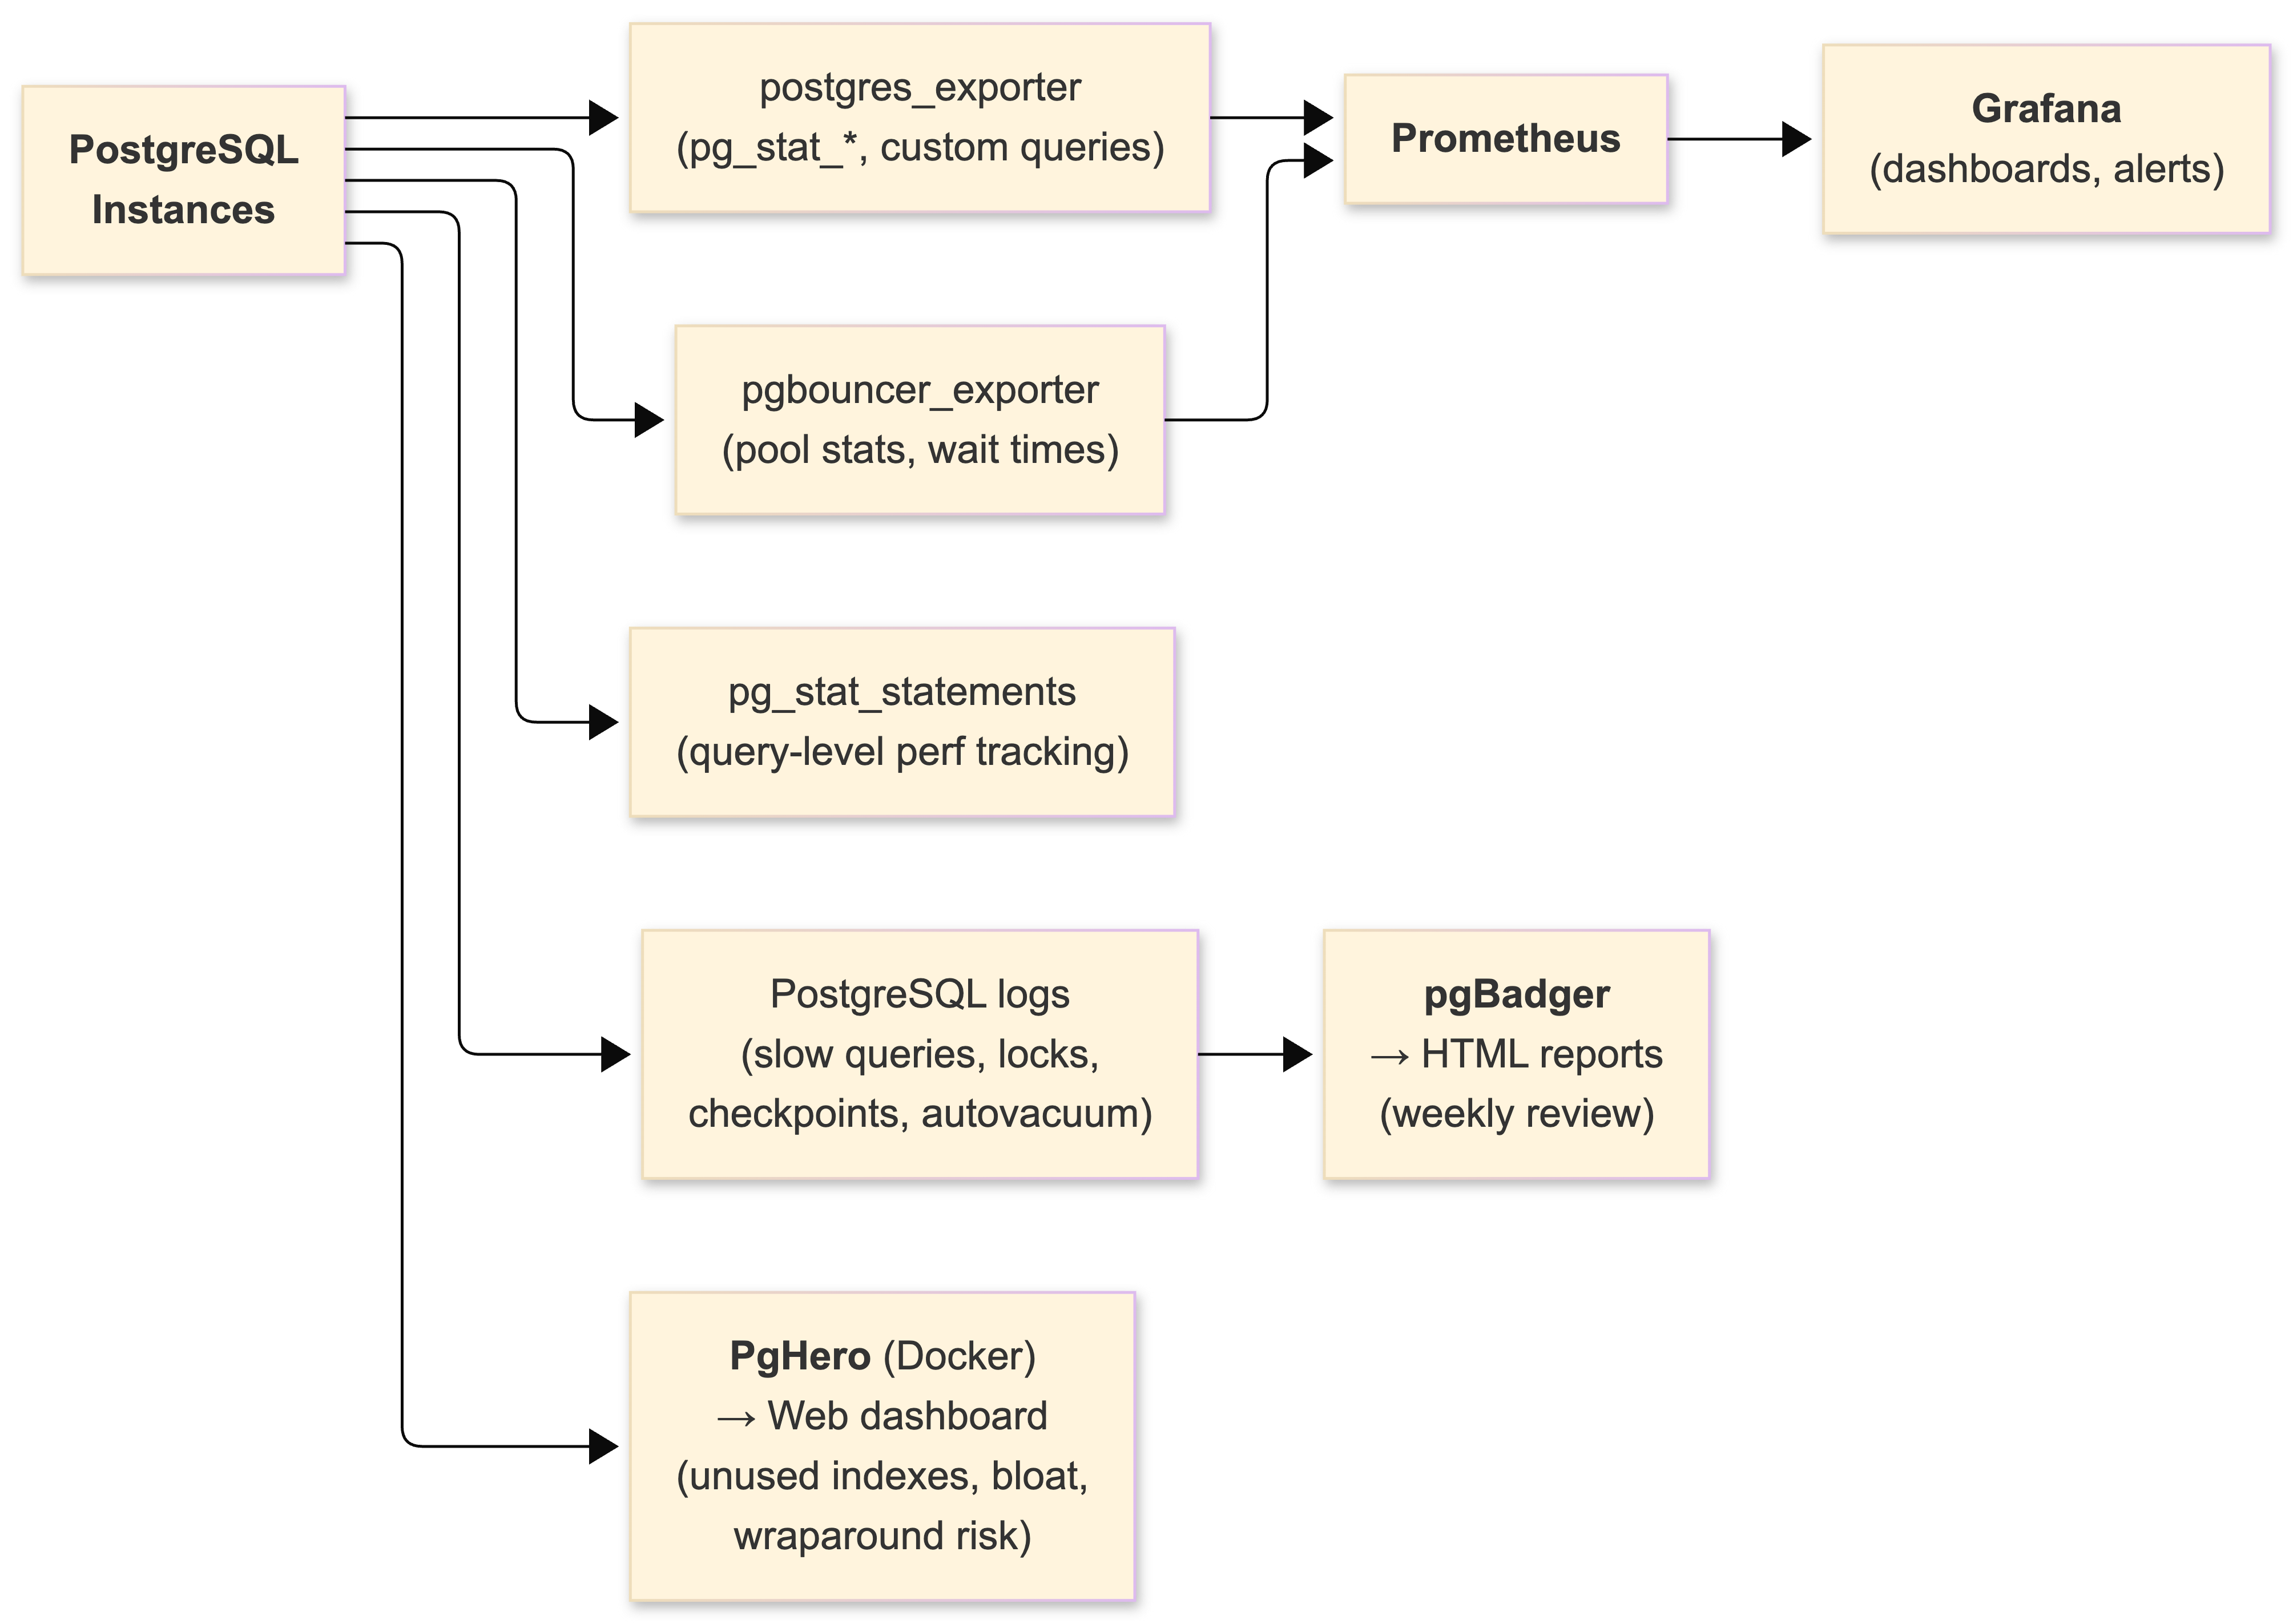
pg_stat_statements
Installed on every instance. Tracks per-query statistics normalized by query pattern. Our weekly review:
-- Top 10 queries by total execution time
SELECT
    left(query, 80) AS query_preview,
    calls,
    round(total_time::numeric, 2) AS total_time_ms,
    round(mean_time::numeric, 2) AS mean_time_ms,
    rows,
    round((shared_blks_hit::numeric /
           greatest(shared_blks_hit + shared_blks_read, 1)) * 100, 2) AS cache_hit_pct
FROM pg_stat_statements
ORDER BY total_time DESC
LIMIT 10;
More than once, we've caught an ORM-generated join across six tables that consumed 40% of total query time while serving less than 1% of requests. The fix is always the same: rewrite the query by hand, break it into simpler operations, or push the logic to the application layer. ORMs are useful. Trusting them blindly is not.
Critical Grafana Dashboard Metrics
Seven metrics, always visible:
| Metric | Source | Baseline | Alert Threshold |
|---|---|---|---|
| Transactions/sec | pg_stat_database | 15,000 TPS | < 5,000 (degraded) |
| Cache hit ratio | shared_blks_hit / total | 99.5% | < 99% |
| Replication lag | pg_stat_replication | < 100ms (async) | > 500ms |
| Dead tuples (top tables) | pg_stat_user_tables | < 5% ratio | > 10% |
| Forced checkpoints | pg_stat_bgwriter | ~0 | > 5 per hour |
PgBouncer cl_waiting | SHOW POOLS | 0 | > 0 sustained |
| WAL generation rate | pg_stat_wal / custom | ~50 MB/s peak | > 100 MB/s |
| XID age (max) | pg_class.relfrozenxid | < 100M | > 150M |
pgBadger
Processes PostgreSQL logs nightly with log_min_duration_statement = 100 (capture everything slower than 100ms):
# postgresql.conf - logging for pgBadger
log_min_duration_statement = 100
log_checkpoints = on
log_connections = on
log_disconnections = on
log_lock_waits = on
log_temp_files = 0
log_autovacuum_min_duration = 0
log_line_prefix = '%t [%p]: [%l-1] user=%u,db=%d,app=%a,client=%h '
pgBadger generates interactive HTML reports: slow query distributions, lock wait patterns, temporary file usage, checkpoint frequency, autovacuum activity. After any incident, the pgBadger report is the first artifact we review. It's Perl, it's ugly, it works.
Backups: Because GitLab Taught Us All a Lesson
GitLab's database incident in January 2017 - where an engineer accidentally deleted the primary database directory during a replication recovery attempt, and all five backup mechanisms failed - became our team's cautionary tale. We printed the postmortem timeline and pinned it to the ops room wall. The lesson isn't "don't make mistakes." The lesson is that untested backups are fiction.
Our backup strategy:
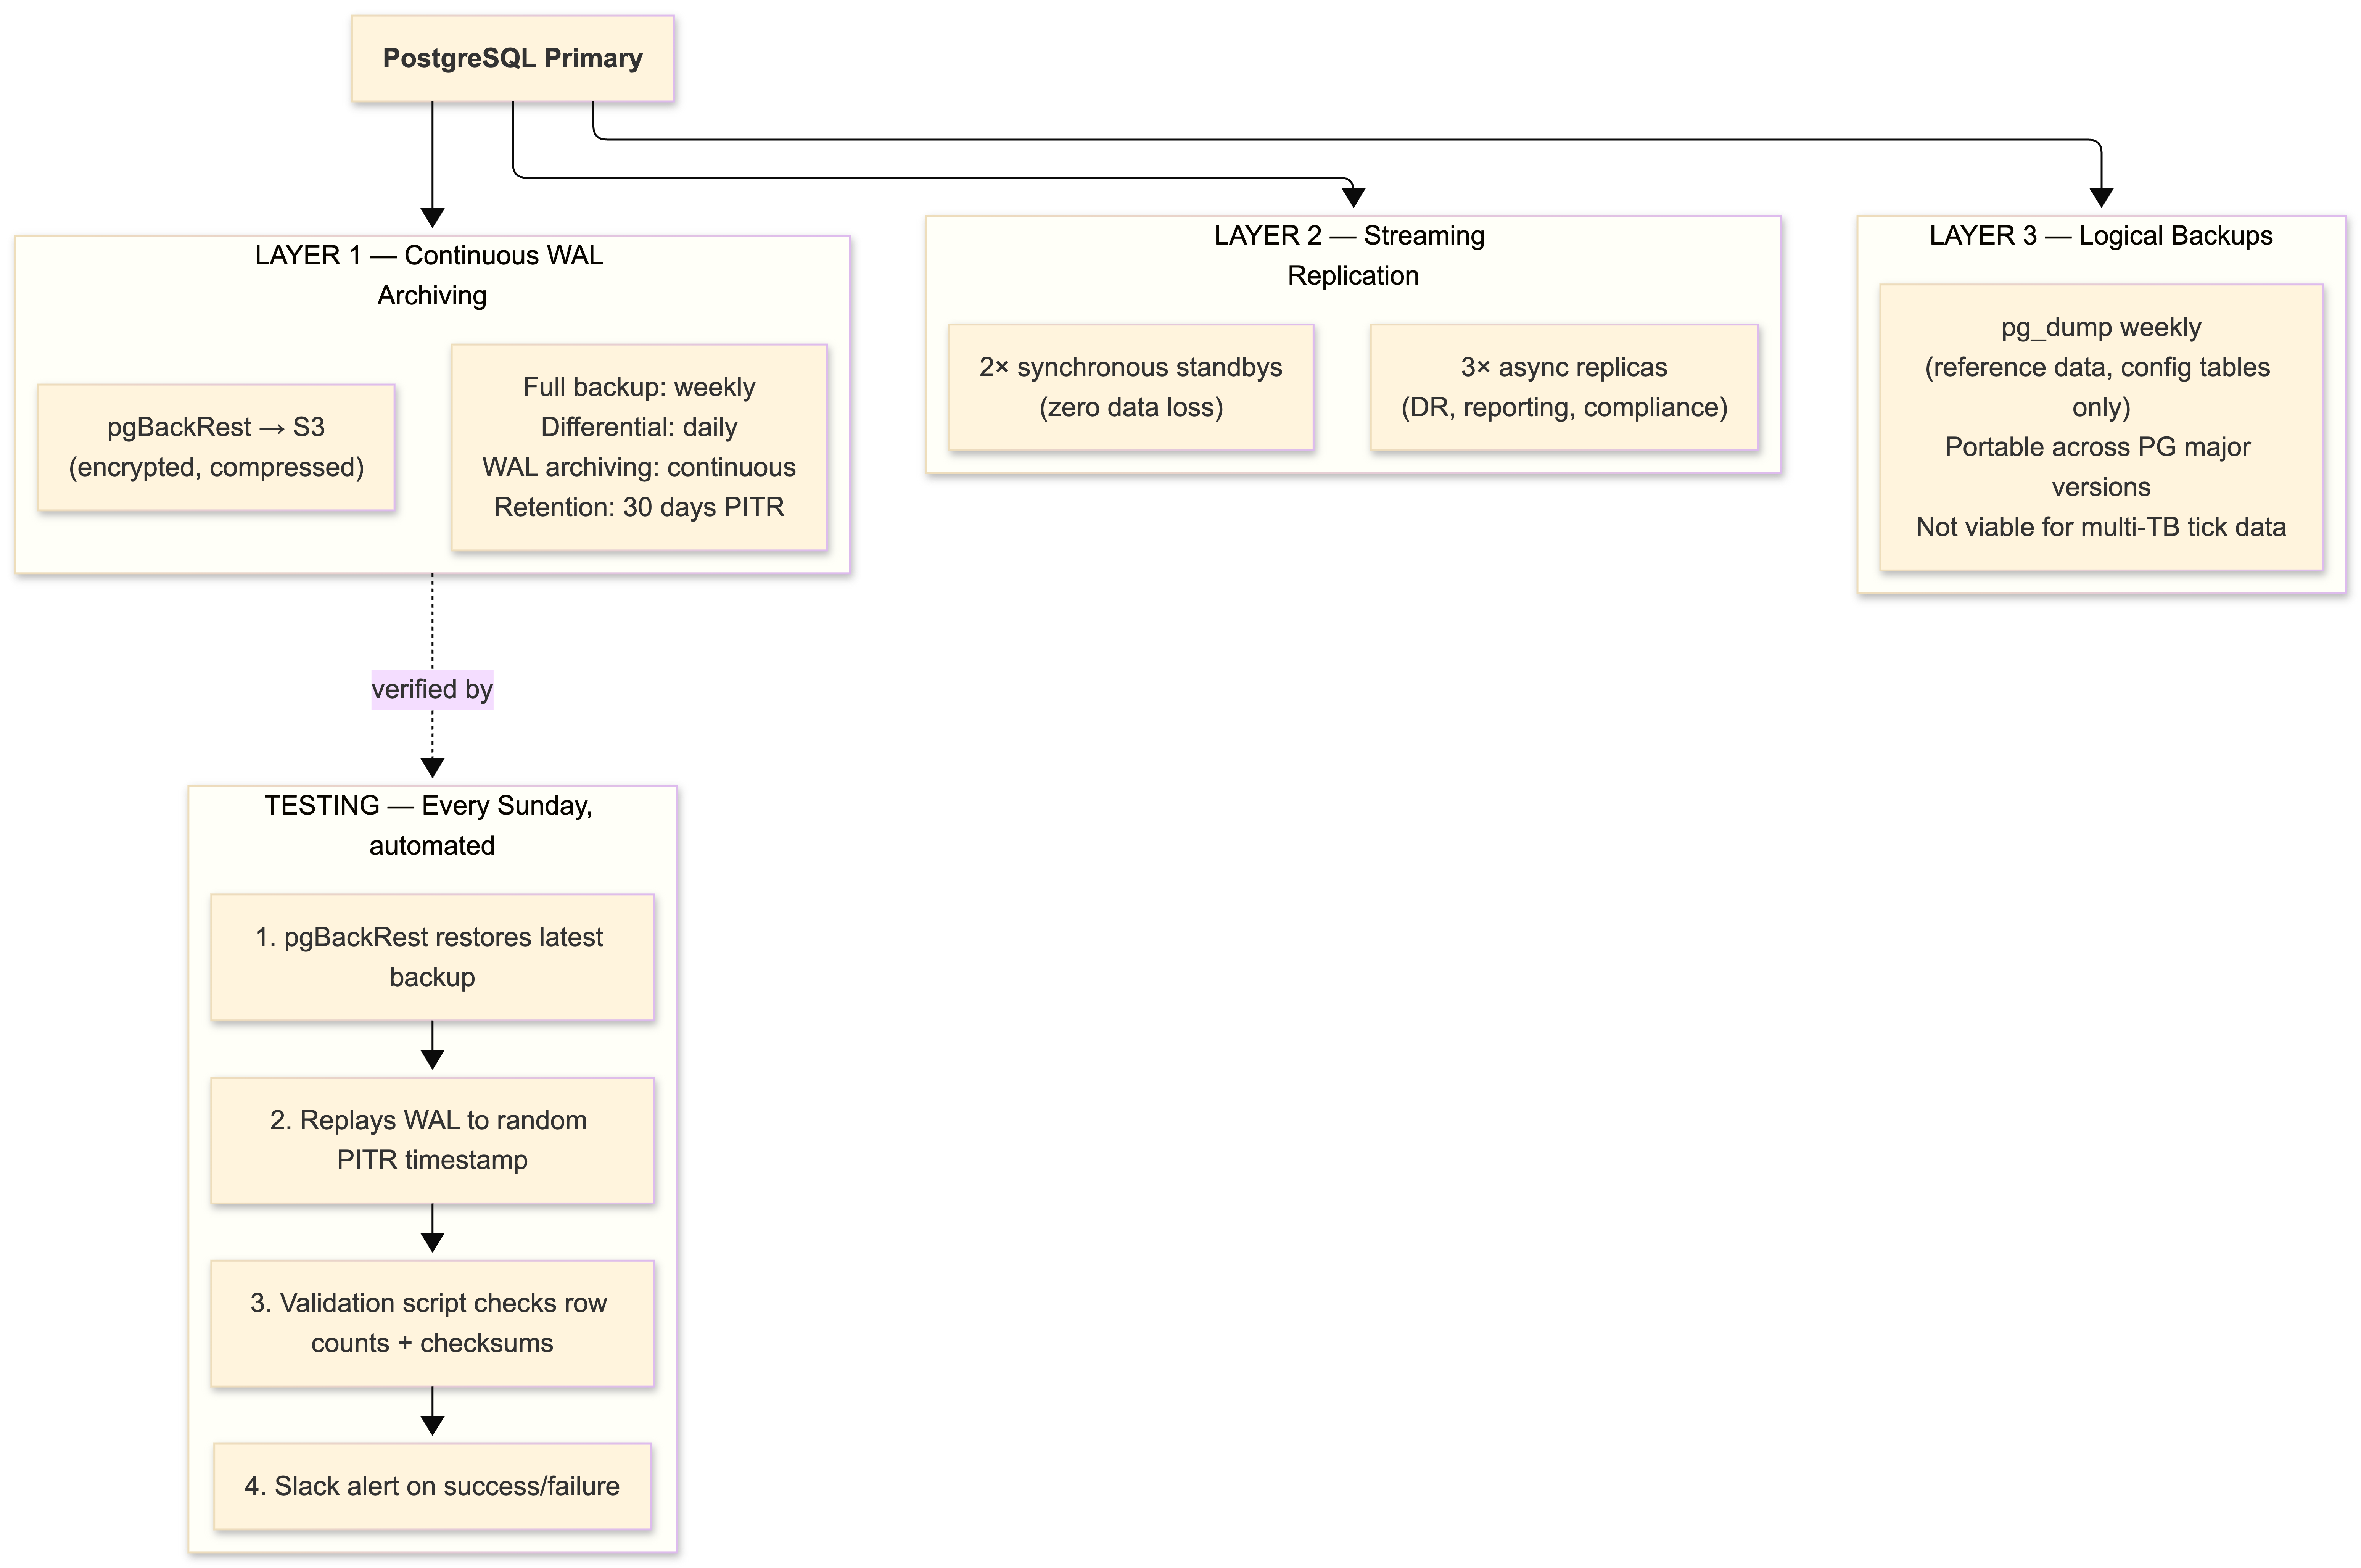
We test restores every week. Not monthly. Not quarterly. Every week. This discipline has caught configuration drift twice - once when an S3 bucket policy change silently broke archive retrieval, and once when a pgBackRest upgrade changed the compression format for new archives while old archives used the previous format. Both would have been invisible until an actual disaster.
Anti-Patterns We Eliminated
Let me save you some pain.
Default configuration in production. PostgreSQL's 128 MB shared_buffers was designed for shared hosting in the early 2000s. If your production postgresql.conf looks like the default, you haven't started tuning yet.
No connection pooling. We initially ran without PgBouncer and hit max_connections limits during market opens. Each of 500+ connections consumed 8 MB of RAM and a process slot. Adding PgBouncer reduced our connection count from 500 to 40 with zero application-visible impact.
ORM-generated queries without review. Our ORM generated a 12-table join for a portfolio summary endpoint. Executed 200 times per second, consumed 35% of database CPU. Rewriting as two simpler queries with application-side assembly: 180ms → 12ms. Always EXPLAIN ANALYZE before production.
UUIDv4 as primary keys. An early microservice used random UUIDs for its primary key. Insert throughput: 13,000/s versus 72,000/s with bigserial. Random UUIDs destroy B-tree index locality and force random I/O on every insert. Use bigserial for the PK, keep a separate UUID column for external identifiers if you need them.
Excessive indexing. Every index must be updated on every write (unless HOT kicks in). We found 14 unused indexes on the orders table using pg_stat_user_indexes where idx_scan = 0. Dropping them reduced write latency by 22%. Check your indexes:
SELECT
    schemaname,
    relname,
    indexrelname,
    idx_scan,
    pg_size_pretty(pg_relation_size(indexrelid)) AS index_size
FROM pg_stat_user_indexes
WHERE idx_scan = 0
  AND schemaname = 'public'
ORDER BY pg_relation_size(indexrelid) DESC;
Long-running queries on the primary. I already told you about the overnight reporting query that nearly caused transaction ID wraparound. All analytical queries go to read replicas. No exceptions. Set statement_timeout on the primary.
What PostgreSQL 10 Changes (and Why I'm Excited)
PostgreSQL 10 dropped on October 5th, and three features directly address our biggest operational pain points.
Declarative partitioning replaces our trigger-based routing. Cleaner syntax, smarter partition pruning, no trigger overhead on every insert. Hash partitioning isn't available yet (expected in PG 11), but range partitioning by date covers our primary use case. We're already testing the migration path in staging.
Logical replication via CREATE PUBLICATION / CREATE SUBSCRIPTION gives us per-table replication to different instances. We'll use this for our compliance database - a subset of production tables replicated to an isolated instance with different retention and access controls. Previously, streaming replication was all-or-nothing. Logical replication also opens the door to zero-downtime major version upgrades. No more weekend pg_upgrade maintenance windows.
Quorum-based synchronous replication (ANY 2 (s1, s2, s3)) lets us maintain synchronous commit guarantees even when one standby is unavailable. Today, if our synchronous standby goes down, we either accept data loss risk or halt writes. Quorum replication eliminates this trade-off entirely.
I'm also watching TimescaleDB, which open-sourced in April. It extends PostgreSQL with automatic time-series partitioning and time-oriented query optimizations. Not production-ready yet - a stable 1.0 is expected sometime in 2018 - but the concept of transparent time-based chunking with full SQL compatibility is compelling for our market data workload. And Citus Data is making horizontal sharding accessible as a PostgreSQL extension for workloads that eventually outgrow a single node. The ecosystem is moving fast.
Conclusion
Running PostgreSQL as the database for a trading platform in 2017 is not just viable - it's advantageous. ACID guarantees, arbitrary-precision arithmetic, advanced indexing, zero licensing cost. The combination creates a compelling case both technically and financially.
But PostgreSQL at scale demands operational maturity. Connection pooling, aggressive autovacuum tuning, and comprehensive monitoring are not optional - they are prerequisites for production stability. The database ships configured for a modest shared server. It's on you to make it perform.
The lessons that matter most aren't about configuration parameters. They're about discipline. Test your backups weekly - GitLab proved that untested backups are fiction. Monitor relfrozenxid age as religiously as you monitor replication lag. Never run analytical queries against your OLTP primary. Review every ORM-generated query with EXPLAIN ANALYZE before it reaches production. Set idle_in_transaction_session_timeout on every instance.
PostgreSQL gives you the tools to build a system that handles tens of thousands of transactions per second with sub-millisecond latency and zero data loss. Whether it actually does that depends entirely on whether you respect its operational requirements.
PostgreSQL 10 marks an inflection point. Declarative partitioning, logical replication, and quorum-based synchronous commits address the three biggest pain points we've encountered in two years. Combined with the ecosystem - Patroni, PgBouncer, pgBackRest, Prometheus, Grafana - PostgreSQL is no longer just a viable choice for financial systems. For many trading platforms, it's the best one.
If you're facing similar challenges, let's talk.
Bring the current architecture context and delivery constraints, and we can map out a focused next step.
Book a Discovery CallNewsletter
Stay connected
Not ready for a call? Get the next post directly.